A Case for Watching a Seemingly Obvious Midterm Election
TLDR: Prediction markets now put Democrats’ odds of flipping the House at 85%. History is clear: a split Congress is the stock market’s preferred outcome, averaging nearly 15% annual returns versus 8% under unified control. The twist in this cycle is that Trump appears indifferent to losing, which could negatively affect the market and offset the potential uplifts.
 The 2026 midterms increasingly look like a foregone conclusion. Trump won 48% of the Latino vote in 2024 — a historic high for a Republican — but his approval among Hispanics has since collapsed to 22%, according to the Economist. Deportation raids targeting ordinary workers rather than violent criminals and tariff-driven price increases have eroded the coalition he built. A new Economist/YouGov poll shows Latinos now favoring Democratic candidates 43% to 27%. Gerrymandering in Texas and elsewhere designed around sustained Latino support may now backfire.
The structural problem is compounded by Trump’s apparent disinterest in fixing it. Rather than defending vulnerable seats, he spent political capital on a Kentucky primary targeting Thomas Massie — a safe Republican seat Democrats didn’t even contest in 2024. He has remained strategically ambiguous about endorsing John Cornyn in Texas despite Cornyn being the stronger general-election candidate. The Economist concludes that Trump may have already accepted losing the House and is instead playing for legacy and base loyalty. Prediction markets have moved accordingly, with Democratic odds of flipping the House rising from 69% to 85% over the past six months.
What history says about the stock market and divided government
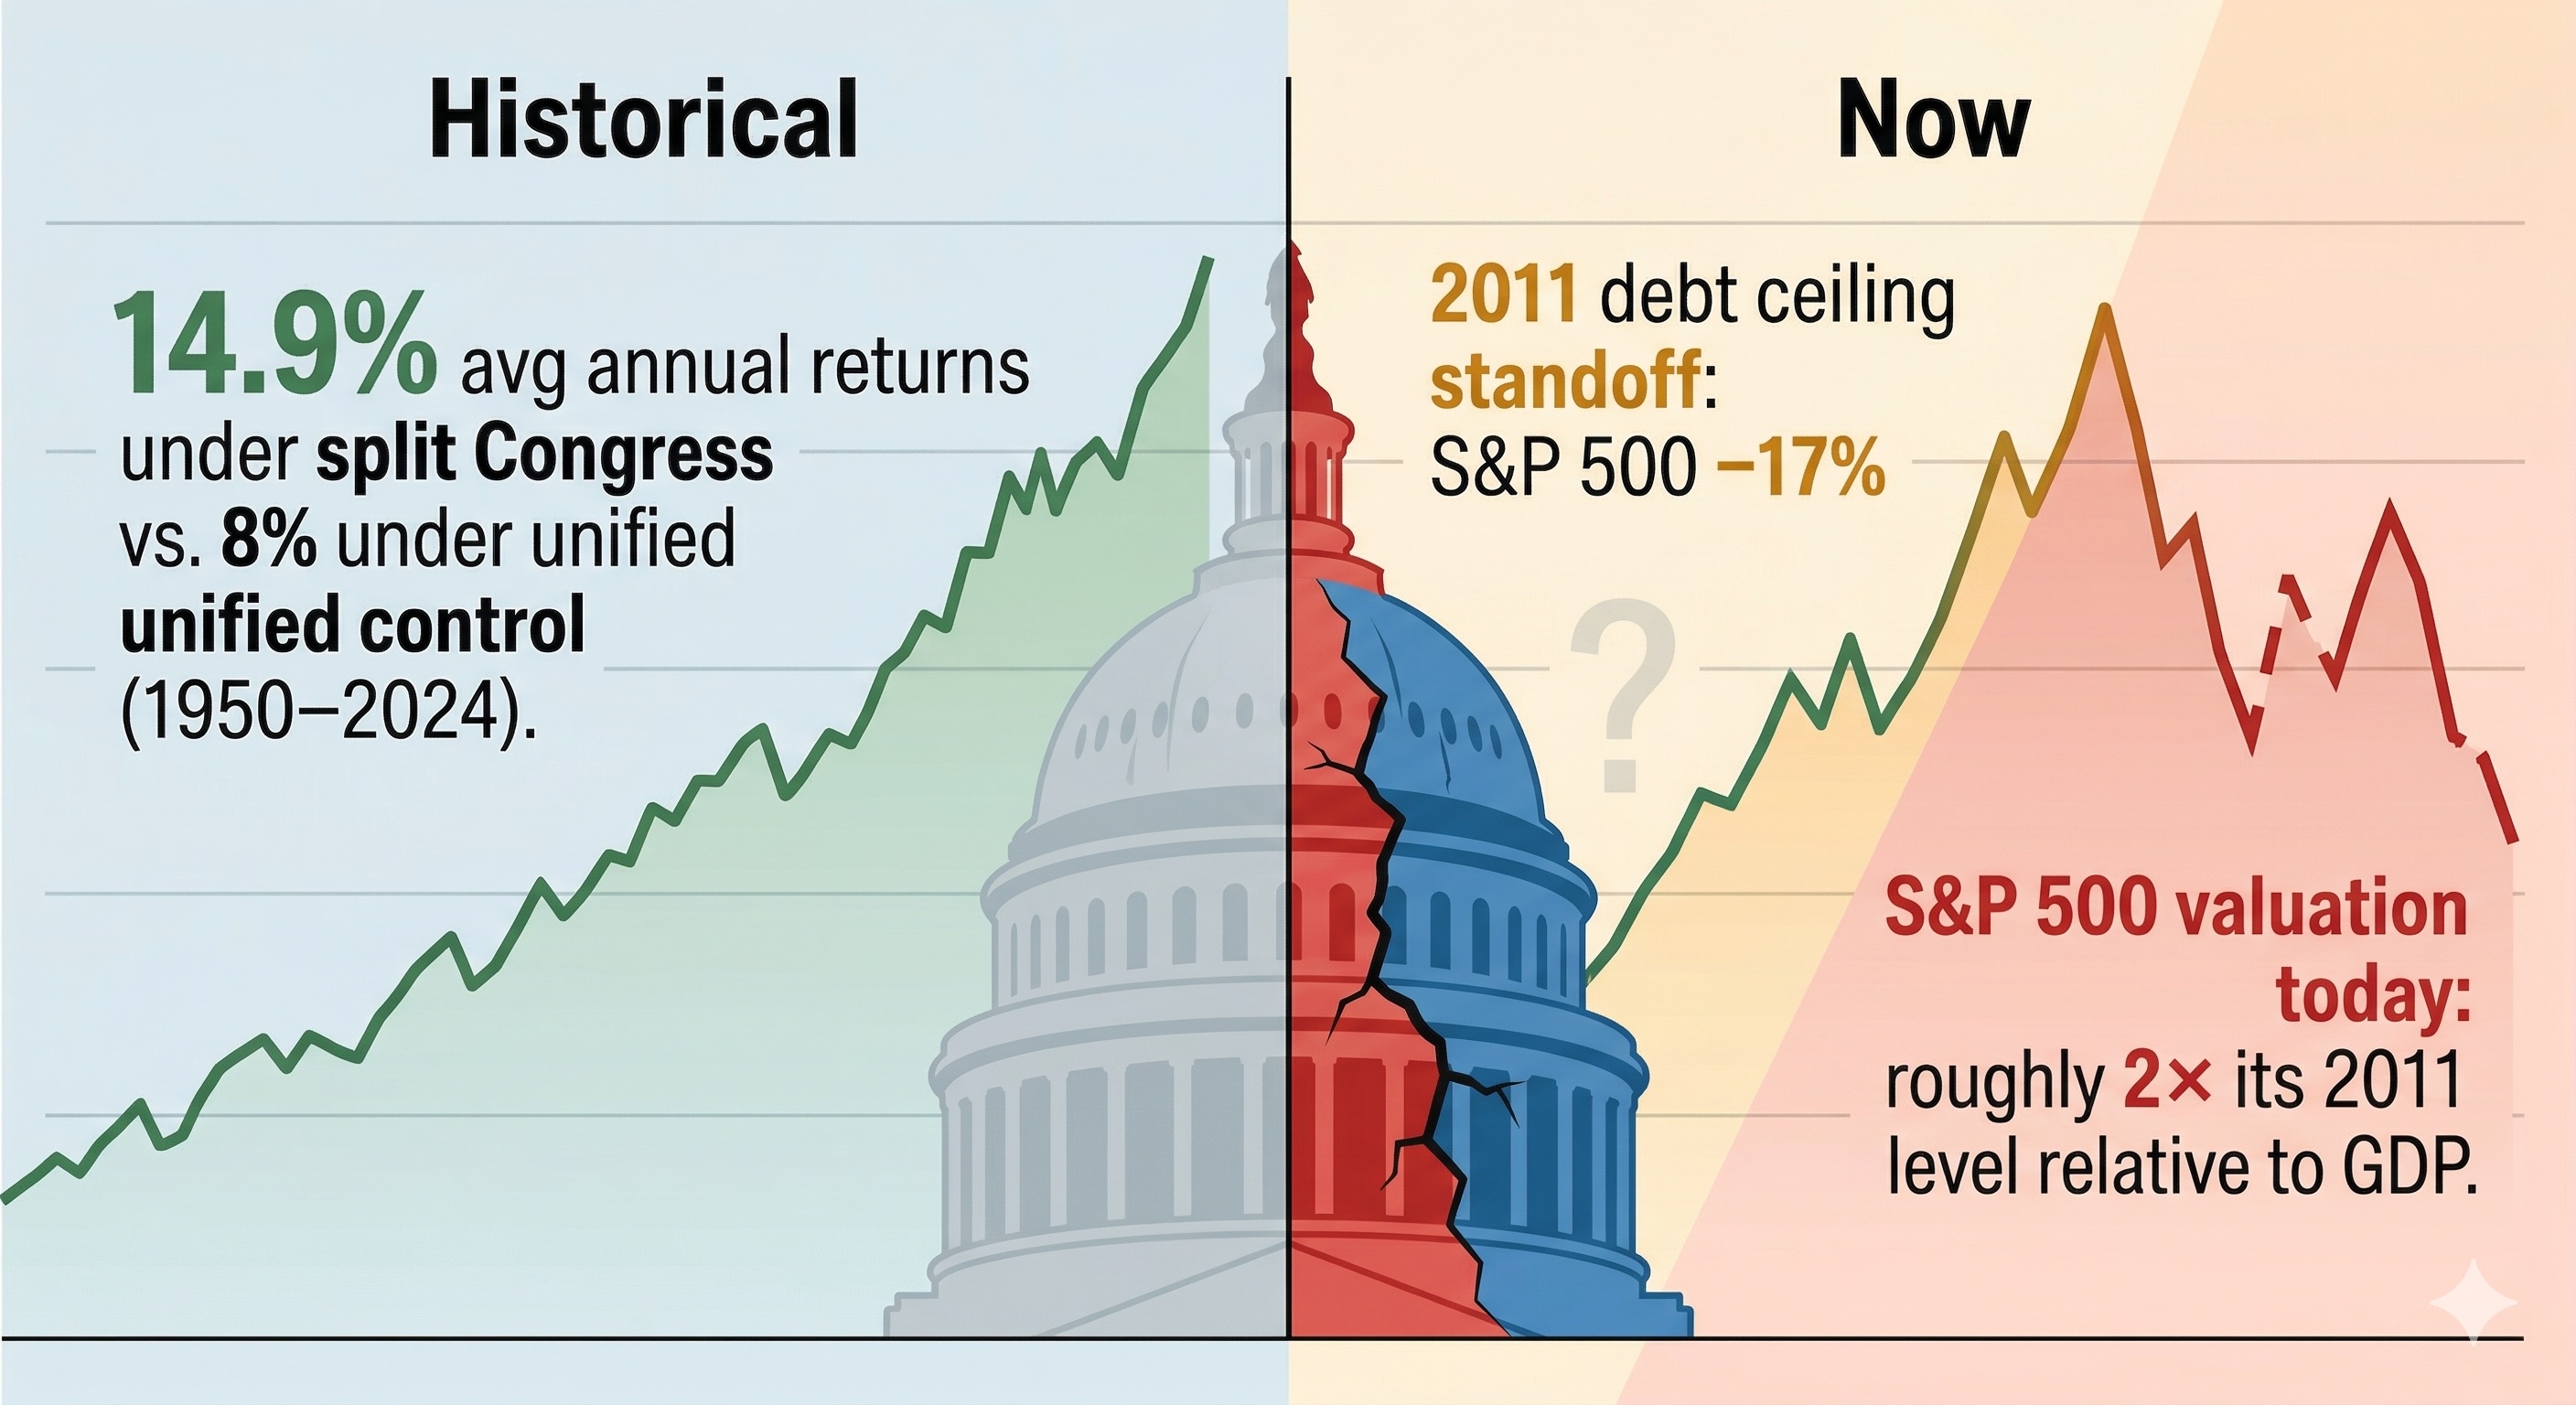
Markets have consistently rewarded gridlock. LPL Research data going back to 1950 shows average stock market returns when Congress is split at 14.9% compared to just 8% when one party controls both the House and the Senate. The intuition is straightforward: divided government constrains fiscal adventurism in both directions. It limits runaway spending and reduces the risk of abrupt policy reversals — and investors price that predictability.
U.S. Bank’s analysis of 75 years of market data found that Republican control of the White House alongside full Democratic control of Congress produced positive absolute returns modestly below the long-term average — still positive, and still better than many investors might assume heading into a Democratic wave.
There is, however, an offsetting lame-duck dimension worth noting. Historical data shows the S&P 500 averaging 5.4% returns in lame-duck election years compared to 7.3% when the incumbent is seeking re-election. A president who appears to have internalized he is already a lame duck fits this pattern — lower short-term economic performance motivation, more focus on consolidating political identity.
How and why this cycle could be different
 The standard gridlock-is-bullish story has a complication. Trump signed the One Big Beautiful Bill in July 2025, which made most provisions of the 2017 Tax Cuts and Jobs Act — the landmark legislation that lowered the corporate tax rate from 35% to 21% and reduced individual income tax rates across brackets — permanent. That removes one source of near-term tax uncertainty. But a Democratic House creates a new one: the credible threat of reversal in a future unified Democratic government, particularly on corporate rates and the 20% pass-through deduction for small businesses. Markets will begin pricing that tail risk well before 2028.
More immediately, a Democratic House means debt ceiling fights, potential government shutdowns along with blocked supplemental spending. Research published in the Journal of Banking and Finance finds that legislative gridlock increases dispersion in returns across individual stocks — meaning sector and stock-picking skills could matter more in gridlocked environments than in unified ones.
The size of the majority is what transforms routine gridlock into genuine market risk. A narrow Democratic House means spending fights and delayed budgets — noise investors have priced before. A decisive majority gives Democrats real leverage on debt ceiling negotiations, which carry a hard deadline and a demonstrated capacity to move markets sharply. The 2011 standoff sent the S&P 500 down roughly 17% and did not recover to its pre-crisis average until well into 2012 — with financials, materials, and industrials absorbing the worst of it. A repeat in 2027, with a lame-duck president and an S&P 500 trading at roughly twice its 2011 valuation relative to GDP, would hit the same sectors harder and faster. The variable to watch is not whether Democrats flip the House. It is by how much.
Comments